

Cleanup Has a Cost. So We Measured It.
We completed a full greenhouse gas inventory of our marine debris operations to establish a carbon baseline, measure emissions intensity, and ensure that scaling plastic cleanup in Alaska is aligned with climate accountability.
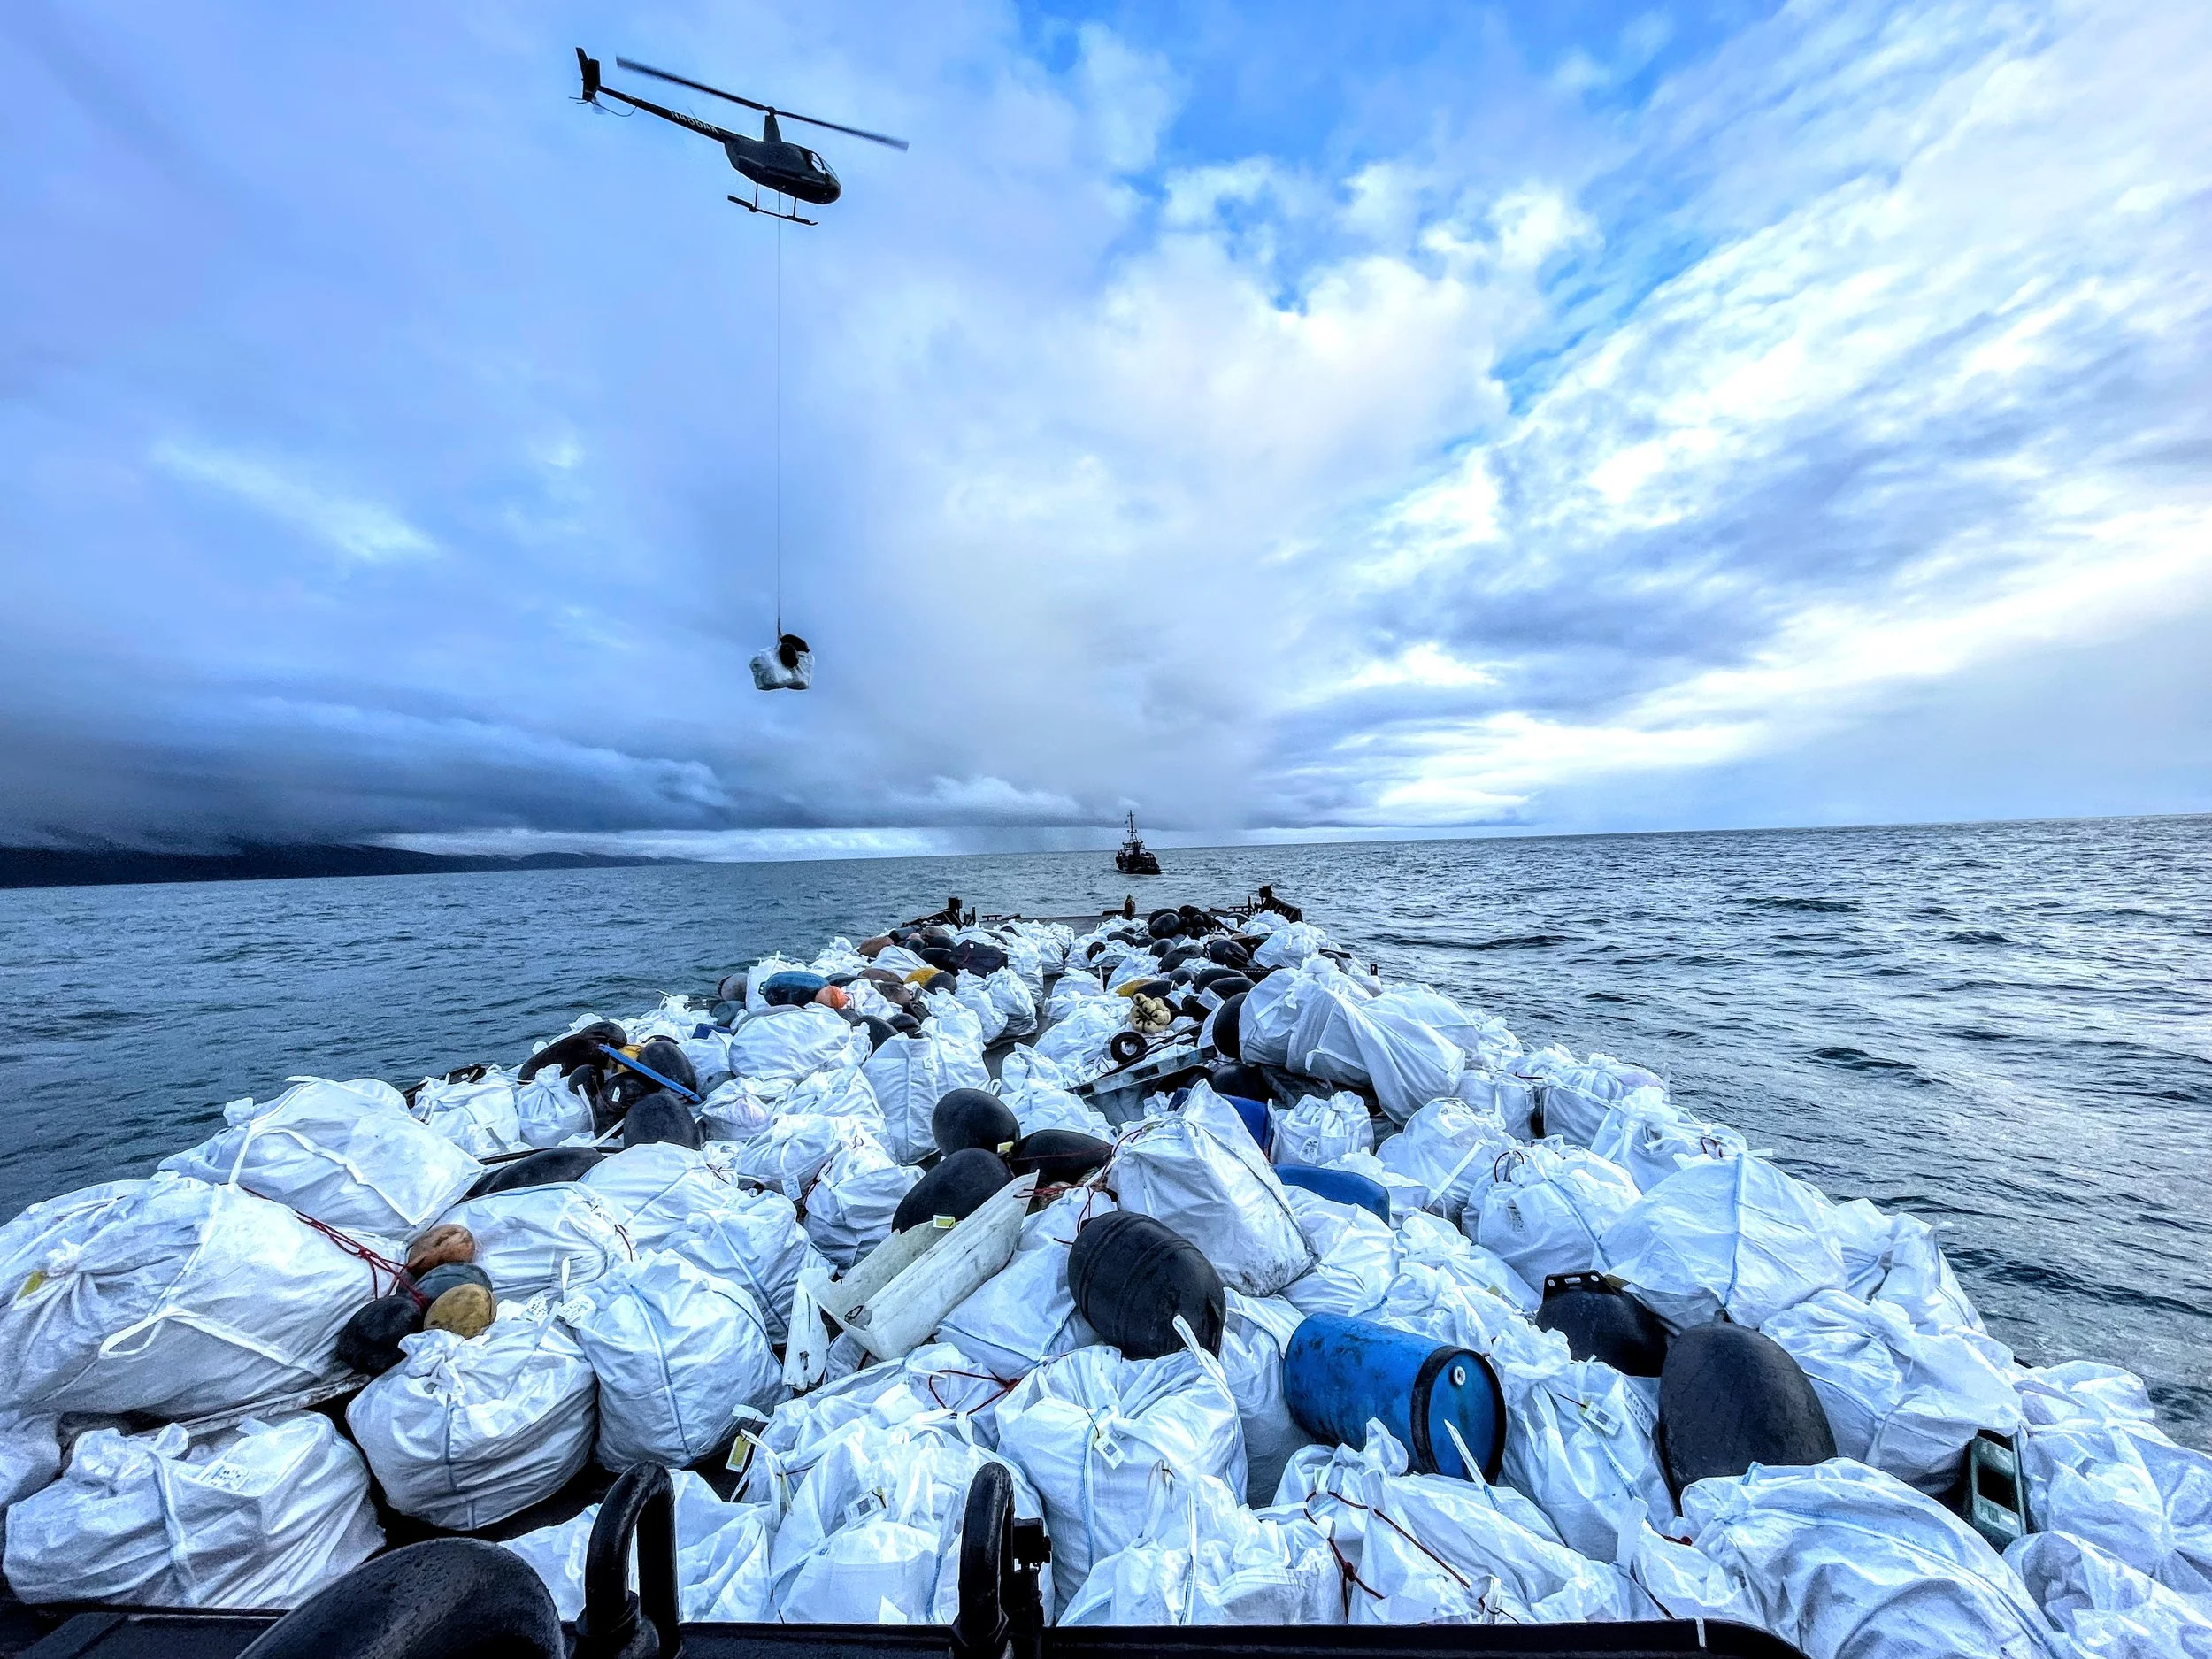
Ocean Plastics Recovery Project exists to remove plastics from the natural environment and to develop responsible pathways for reuse, recycling, and recovery. That work is grounded in ecological repair, but it is carried out using vessels, aircraft, equipment, and facilities that consume energy. Diesel, gasoline, propane, and electricity are part of the operational reality of working in remote Alaska. If we intend to position marine debris removal as serious environmental infrastructure, then it follows that we should understand and account for the greenhouse gas emissions associated with our own operations.
Over the past three seasons, OPR partnered with Island Trails Network to complete a formal greenhouse gas inventory covering marine debris removal activities across Kodiak and Kayak Islands. The inventory was structured under the Greenhouse Gas Protocol and focused on Scope 1 and Scope 2 emissions, quantifying fuel combustion from vessels, helicopters, generators, and onshore equipment, as well as electricity used in processing . The immediate objective was to establish a defensible baseline and to develop emissions intensity metrics that allow us to evaluate performance over time.
Plastic pollution and climate change both exert pressure on the same marine ecosystems. Addressing one while remaining indifferent to the other would be inconsistent with the broader stewardship responsibilities that guide this work. Measuring emissions is therefore not an exercise in self-criticism; it is a practical step toward ensuring that growth in cleanup capacity is aligned with climate accountability.
Although you can read the full report here, two visuals from the report illustrate the central findings.
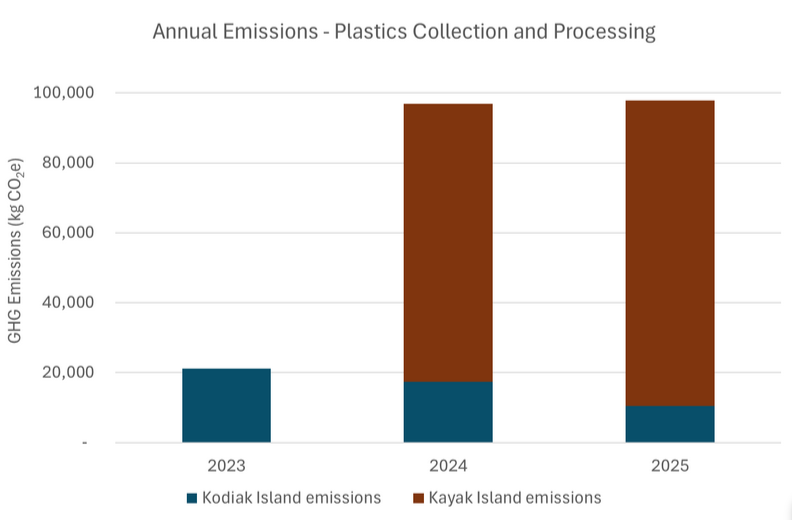
Figure 3: Annual Emissions for marine debris removal projects reviewed in this inventory.
Figure 3 presents total operational emissions across collection and land-based activities by year. The figure reflects changes in scale and geography of operations, showing how energy use increases as the scope of recovery expands. It provides a clear reference point for future reductions in emissions intensity even as total impact grows.
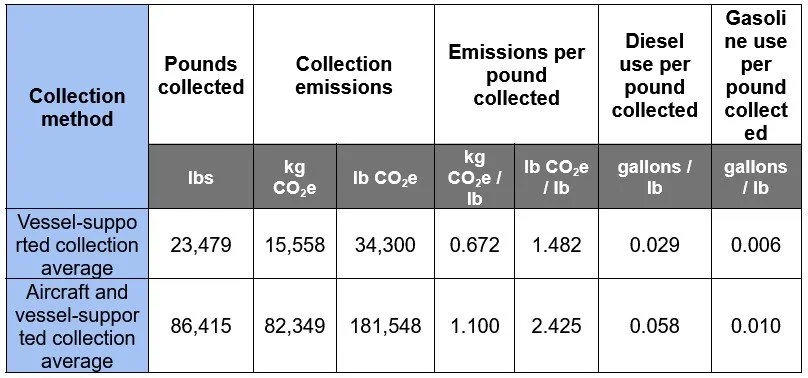
Table 5: Comparing Collection Methods
Table 5: Comparing collection methods summarizes emissions per pound collected and associated fuel use intensity. While raw totals are informative, these intensity metrics are more consequential from a management standpoint. They connect operational design directly to carbon outcomes and provide a framework for evaluating logistical decisions, fuel strategies, and equipment deployment.
The inventory concentrated first on collection emissions because marine transport and remote mobilization account for the majority of energy use. Land-based emissions currently represent a small portion of the total profile, in part because Kodiak Electric Association supplies over 99% of its energy from renewable hydroelectric and wind sources. Under market-based accounting, this results in very low Scope 2 emissions for processing equipment at our Kodiak facility. For that reason, the processing side of OPR’s operations was a lower priority in this initial phase.
However, understanding processing emissions are important in the long term. In the future there will be other facilities like ours, on other grids, who process ocean waste. As volumes increase and distribution pathways mature, future inventories will examine equipment efficiency, facility energy use, and downstream transport in greater detail. Distribution to Tacoma and onward to recycling or pyrolysis facilities falls under Scope 3 and would need to be incorporated to develop a comprehensive emissions profile as the program scales .
One of the more useful outcomes of the inventory is understanding where emissions are concentrated. Marine fuel combustion, particularly diesel use in transportation, represents the primary driver within our current operational structure. Identifying that concentration has directed our attention toward practical mitigation strategies such as fuel substitution, trip consolidation, and efficiency improvements.
Alaska supplies the largest share of wild-caught seafood in the United States, and the resilience of its marine ecosystems carries both ecological and economic significance. Marine debris removal contributes to protecting those systems. Climate stability underpins them as well. A greenhouse gas baseline does not resolve every tension between restoration and energy use, but it establishes a starting point.
Cleanup has a cost, and understanding that cost allows us to manage it responsibly. By measuring emissions now, OPR can pursue growth with greater precision, reduce emissions where feasible, and demonstrate that ecological restoration and climate accountability can proceed together within the same operational framework.
Read the full report here.